 Aimatra
PYBAMM / WORKED EXAMPLE
Your first battery charge–discharge simulation
Follow one executed Chen2020 example from its input protocol to three readable curves. This is a reference simulation, not measured battery data.
First, look at the result
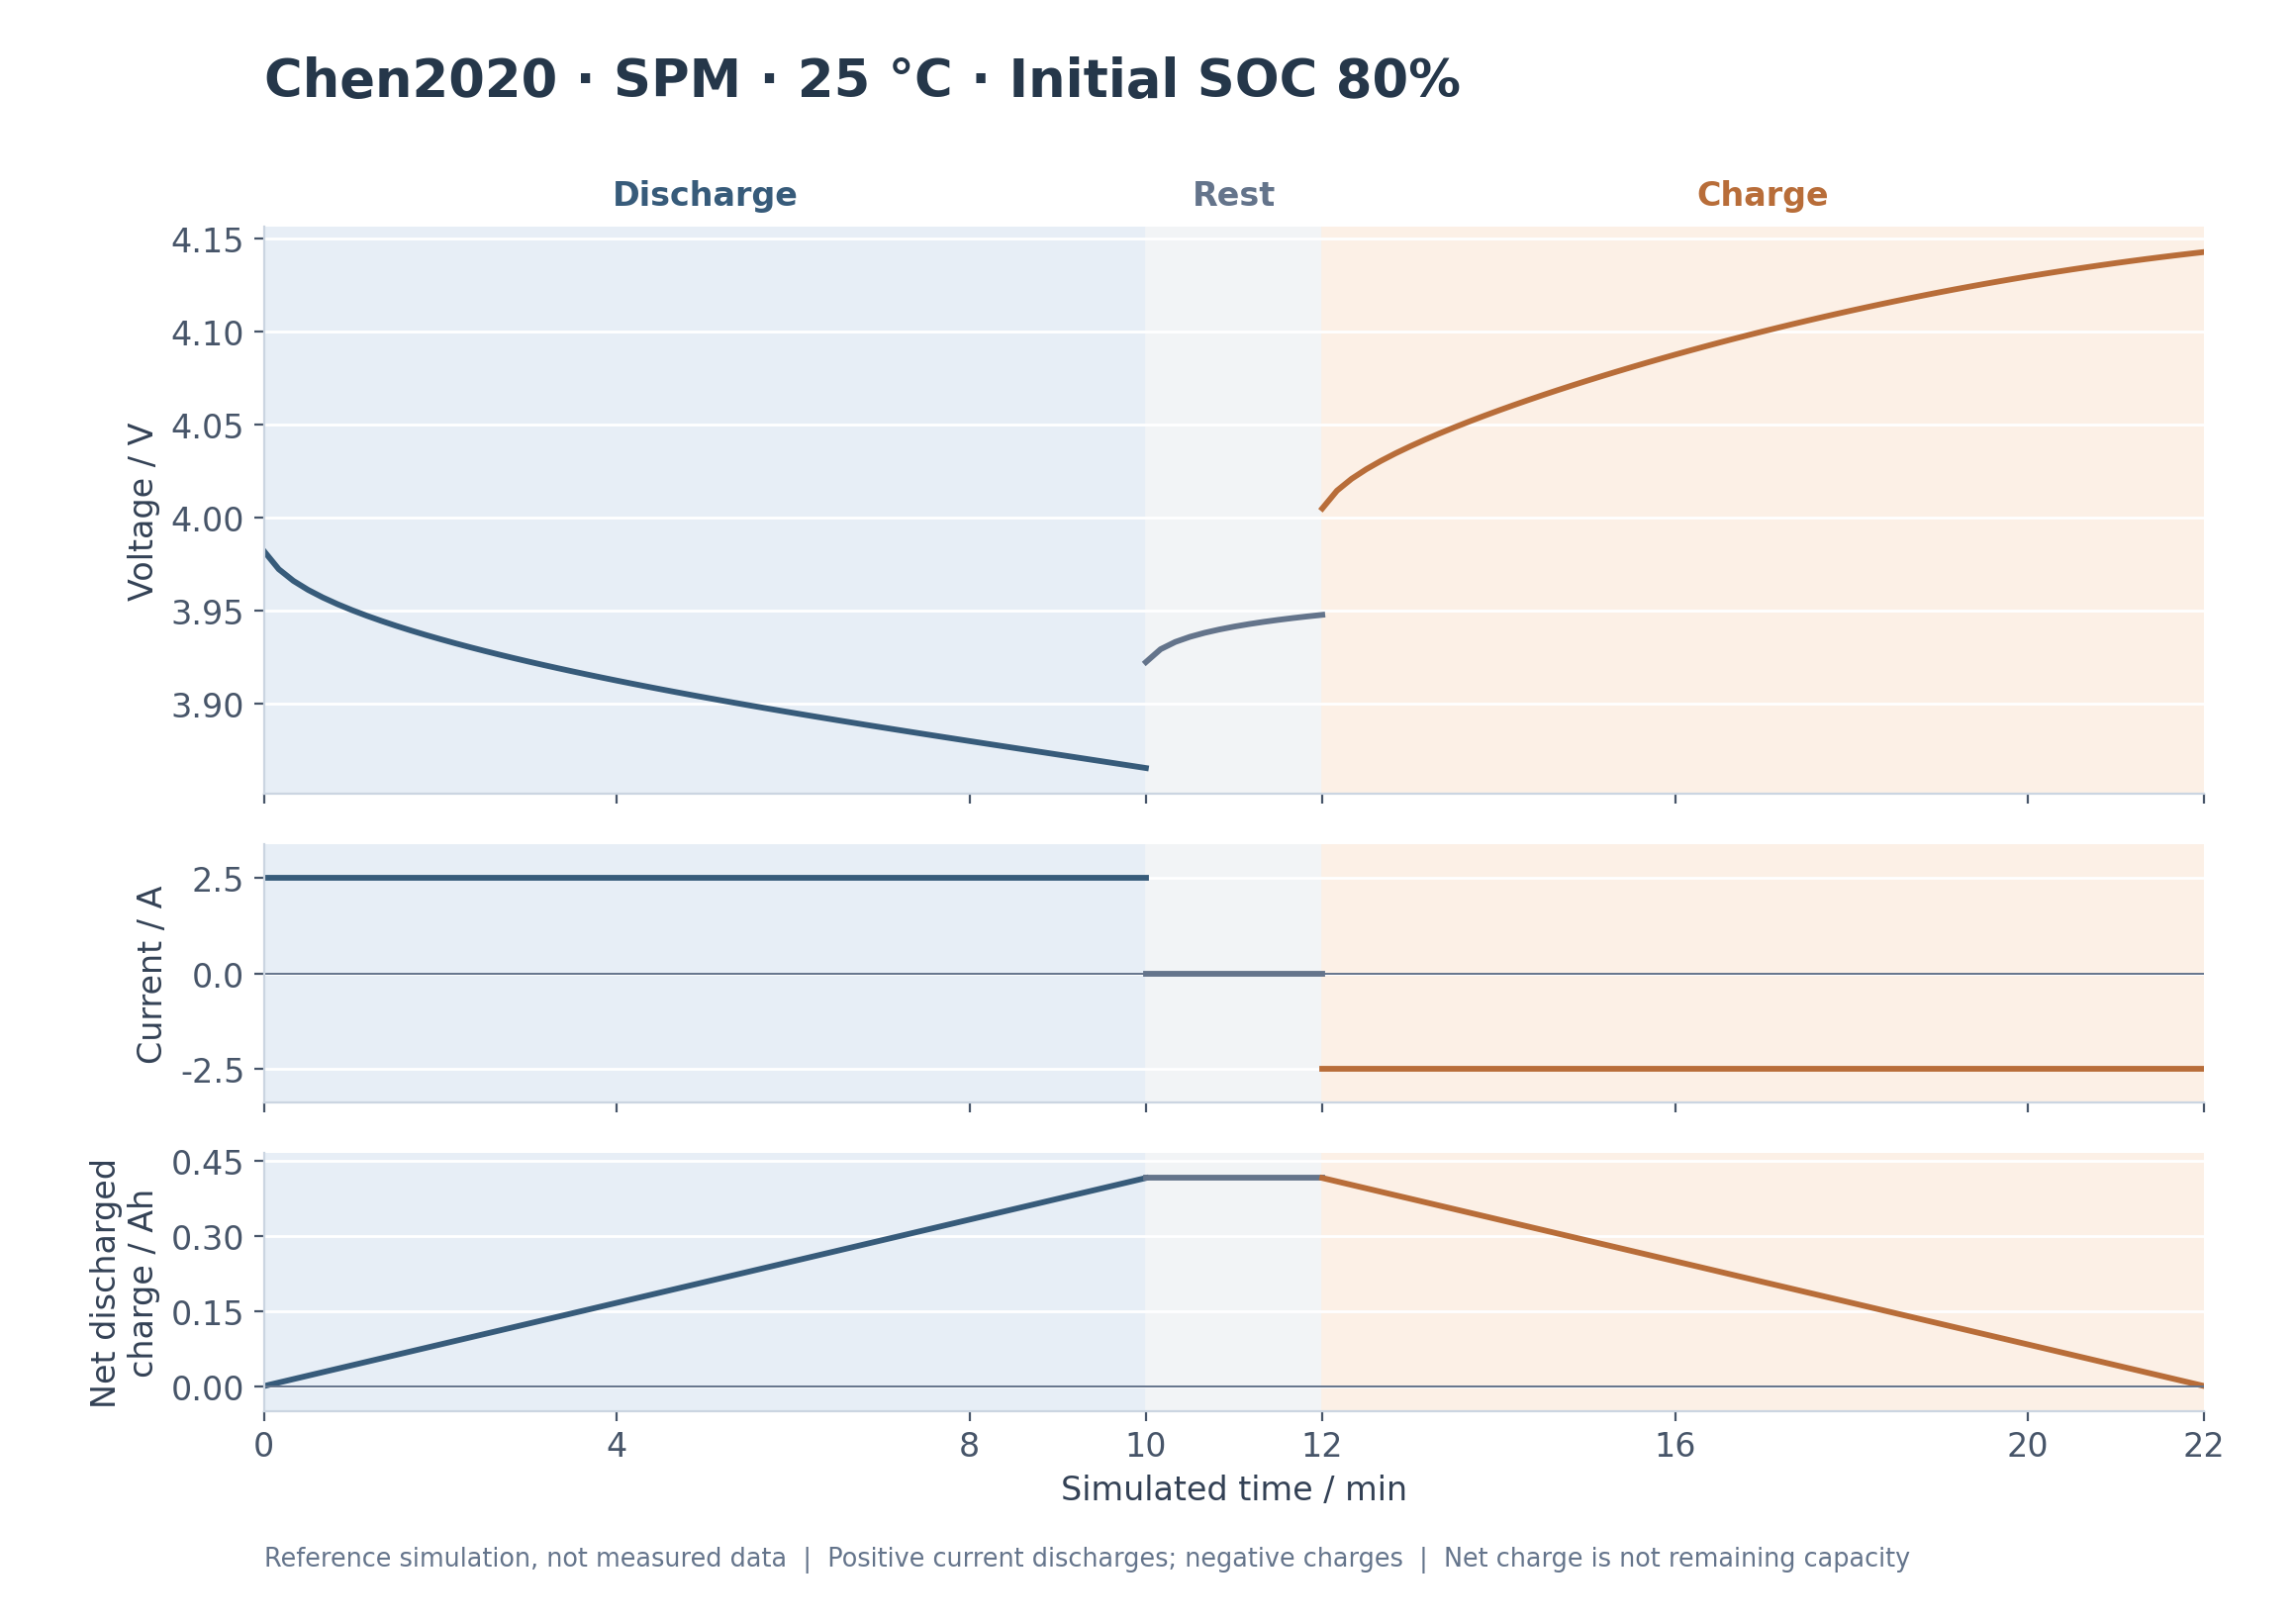
Read the three panels on the same time axis. Positive current is discharge; negative current is charge; zero current is rest.
Open full-size figure
- Voltage range
- 3.8655–4.1429 V
- Charge discharged
- 0.4167 Ah
- Charge charged
- 0.4167 Ah
- Final net discharged charge
- ≈0 Ah
Why does net discharged charge return close to zero?
Net discharged charge is the charge sent out during discharge minus the charge put back during charging. It is not the cell's total capacity. Returning roughly the same charge makes this running total approach zero; it does not mean the battery has no capacity, its SOC returns exactly, or there is no energy loss. It does not establish battery lifetime either.
Understand the inputs
This example uses the single-particle model (SPM) with the Chen2020 parameter set. SPM approximates each electrode with one representative particle; this case does not resolve full electrolyte transport. It is a teaching case, rather than a fit to your own battery.
- Initial state of charge
- 80%
- Temperature
- 298.15 K (25 °C)
- Nominal capacity
- 5 Ah
- Sampling period
- 10 s
C-rate converts nominal capacity into current. Here, 0.5C × 5 Ah = 2.5 A. The discharge step uses the positive current, and the charge step uses the negative current.
| Step | Simulated time | Current | Start → end voltage |
|---|---|---|---|
| 1. Discharge | 0–600 s | 2.5 A | 3.9821 → 3.8655 V |
| 2. Rest | 600–720 s | 0 A | 3.9224 → 3.9478 V |
| 3. Charge | 720–1,320 s | -2.5 A | 4.005 → 4.1429 V |
Each step has a finite duration. The report records why it stopped; this example does not demonstrate voltage-cutoff events or test a hardware operating limit. Keep the supplied protocol unchanged for your first reproduction.
Run it in your own project
Download and extract the example into a new folder. Install Python 3.12 first, then open a terminal in that folder and choose your operating system below.
- Create an isolated Python environment and install the locked dependency versions. This installation requires network access.
- Run the supplied protocol into a new my-run folder. Make the figures in my-figures so the reference outputs stay intact.
- Compare your report and curves with the supplied reference. Runtime and small numerical differences depend on the environment.
The lockfile records this run's Windows / Python 3.12 environment. macOS and Linux need compatible package wheels. If installation fails, inspect the Python version, architecture and error before adapting dependencies; do not change versions blindly. requirements.txt lists the direct dependencies for an informed adaptation; record any differences and repeat the checks.
py -3.12 -m venv .venv
.\.venv\Scripts\python.exe -m pip install -r requirements-lock.txt
.\.venv\Scripts\python.exe simulate_battery.py protocol.json --output my-run
.\.venv\Scripts\python.exe plot_results.py my-run --output my-figures
You can also select and copy the commands manually.
These commands run locally and do not need an AI API key. This page does not run simulations or receive your files. To work through the case with Codex or Claude Code, open this folder as a project and use the installation and first-use requests in the Skill guide.
Open the Skill installation and first-use guideCheck the result, not just the picture
The run compares a baseline calculation with tighter solver tolerances, then with a finer mesh. The report evaluates 101 interpolation points within each corresponding step. The changes below are the largest at those sampled points, not a global error bound or proof of convergence.
| Comparison | Largest sampled voltage change |
|---|---|
| Baseline → tighter solver tolerances | 0.001 mV |
| Tight solver, mesh 20 → 40 | 2.1686 mV |
Largest end-time difference: 0 s. A numerically stable result is not proof that it matches a real battery. The parameters, initial state and measurements would need separate checks.
Which files should I inspect?
curve.csv contains the baseline time series. Compare it with tight-tolerance.csv and refined-mesh.csv. Read report.json for the settings and checks, and parameters.json for parameter provenance. The base Current function [A] parameter is not the actual current for every step: protocol.json sets each step's current. Preserve both files for reproduction.
Execution environment, tolerances and source
Executed on 2026-10-20. This record covers this reference simulation only, not every Skill workflow or a measured-cell validation.
Final net discharged charge, unrounded: 8.534839501805891e-16 Ah
- pybamm
- 26.9.0.0
- pybammsolvers
- 0.10.0
- numpy
- 2.5.4
- scipy
- 1.18.1
- casadi
- 3.8.1
- matplotlib
- 3.10.7
- python
- 3.12.14
- platform
- Windows x64
- Baseline rtol / atol
- 1.000e-6 / 1.000e-8
- Tight rtol / atol
- 1.000e-8 / 1.000e-10
- Skill version
- 1.1
- Upstream commit
- 593377bb048752abb0152deab9fbb1083a6087df
- Script SHA-256
96c9c774860a80f3fddda2fd94d90905e9254b766f191a79e843613ec4da7647- Protocol SHA-256
f769f94f1a9f933d253b3a4a6f51dc661b8af49bf9df52cfdabd81ea185de80e
The PyBaMM library is licensed under BSD-3-Clause. The K-Dense Inc. Skill and simulation helper use MIT; other dependencies retain their own terms. The example preserves the component notices and source credit. Chen2020 is a PyBaMM reference parameter set, and this case uses no measured data.
Keep the complete reproducible example
The bundle contains the simulation and plotting scripts, original protocol, dependency lists, reference CSVs and reports, figures, README, recording script and component licence notices.
An account is required. Your download continues after sign-in.
Bundle 1.0.1 · 400,982 bytes
SHA-256: 9088ac565a8984a921ae9b58a9d5f704c69068c039ace1231d6864b0a5767464
A 5–7 minute recording outline
Use the sections above as a recording sequence. This is an outline for presenting the executed example; the downloads include a Chinese script.
- Introduce the reference simulation and what it can answer.
- Read the three protocol steps, initial SOC and temperature.
- Download the example, open a new project and explain the environment.
- Run the commands; show the output folders without promising a fixed runtime.
- Read the voltage/current plots and explain net discharged charge.
- Compare solver tolerances and mesh density; distinguish numerical from experimental checks.
- Show the report, source versions and how to reproduce the case.